Many of you were thrilled to hear about our significant Traffic Growth over 2009, and we’re happy to anounce the the trend has continued for the first six months of 2010. If you are wondering how this scale compares to our previous enquiries graph,rest assured that the last week shown here had over double the amount of enquiries experience in our best week of 2009 (the week before Christmas).
The only hiccup in growth this year (the section circled in yellow) was due to the Seacom Cable going down. This cable carries much if the Internet Traffic between our South African users and the TravelGround Server in London, so when a section of the cable broke in the middle of the Mediterranean, we were left at the mercy of a repair ship that took almost 2 weeks to get the repair done.

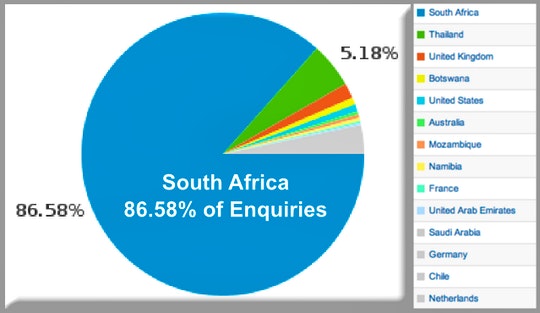
People tend to think that this magnitude of growth must be linked to the current Soccer World Cup, however most of our customers are South African’s traveling South Africa. Upon analysis of enquiries over the last six months, you can see that over 85% of our business is generated by local interest, pointing strongly towards sustainability.
So here’s hoping our next 6-monthly report is even more impressive!